


Gambling Advertising in Australia: Placement and Spending
SYDNEY, NSW, Australia (October 30, 2023) — Gambling Advertising in Australia: Placement and Spending Study.
Overview

Gambling is a common form of entertainment in Australia, with around 73% of Australian adults gambling at least once in the 12 months from July 2021 to July 2022. However, gambling can also have severe and lasting negative financial and social impacts on some individuals and their families.
In 2018, the ACMA finalised new rules restricting gambling advertising during live sport on both broadcasting and online platforms. The broadcasting rules came into effect on 30 March 2018 and the Broadcasting Services (Online Content Service Provider Rules) 2018 (Online Rules) on 28 September 2018.
The restrictions supplemented existing broadcasting rules about gambling advertising during live sport. They were implemented to enhance community safeguards during times when children are most likely to be part of the broadcast audience. The Online Rules brought online services in line with television and radio broadcasting services by creating a ‘safe zone’ for children and families to watch live sport across a variety of platforms. It was the first time that online were required to comply with gambling advertising restrictions.
The restrictions apply between 5.00 am and 8.30 pm and ban gambling advertising during play, within breaks in play and 5 minutes either side of the coverage of the live sporting event. At all other times of the day, gambling advertising is not allowed in coverage of live sport during play and allowed in scheduled and unscheduled breaks.
Rules in the Commercial television industry code of practice 2015 are intended to provide extra protections around content that children may see, by restricting gambling advertising on commercial television in G or lower rated programs broadcast at certain times.
Following the implementation of the rules, we conducted monitoring programs to assess the operation and impact of the gambling advertising restrictions and published the outcomes in a gambling advertising research report.
We continued to track complaints from members of the public and undertook analysis to understand the market. We also released our What audiences want position paper about audience expectations for contemporary content safeguards, which notes community concerns around existing advertising restrictions. We have encouraged broadcasters and other content providers to consider these concerns and whether amendments should be made to the various codes of practice in line with community expectations.
This new research – using Nielsen Ad intel data – provides a snapshot of the volume and spend on gambling advertising in Australia between May 2022 and April 2023.
Now, at a time of heightened interest in the impact of gambling advertising, as seen through the House of Representatives Standing Committee on Social Policy and Legal Affairs inquiry, we consider this research a useful contribution to the broader debate on any policy or regulatory reform in this area.
About the research
This research may be useful to inform:
- broader government considerations of potential gambling reforms by offering insights into recent trends in the Australian market for gambling advertising
- industry considerations to revise its codes of practice.
It focuses on the sources of advertising spending, the nature of the services being advertised and the quantity, repetition and concentration of advertising for specific gambling products and services (including differences, if any, between regional and metropolitan (metro) commercial television markets).
It provides a snapshot of the volume and spend of gambling advertising in Australia between May 2022 and April 2023, using Nielsen’s Ad Intel data. Nielsen Ad Intel is an advertising information service which uses spot monitoring methodology to quantify the number of advertising spots on broadcasting and online platforms. Unless otherwise stated, all data in this report is from Nielsen’s Ad Intel and has been rounded to the nearest 100. Due to rounding, some figures may not add to the totals displayed.
Nielsen’s Ad Intel spend estimates provide comprehensive coverage of media, including metropolitan and regional free-to-air (FTA) television, metropolitan and select regional newspapers, select consumer magazines, broadcast metropolitan radio, national out of home, national cinema, general display and social. Nielsen Ad Intel aims to produce the most complete and accurate estimates of advertising expenditure in Australia and it continually refines and improves these estimates as the media landscape in Australia evolves, meaning that the estimates of ad spend provided in this report are correct at the time of release.
Services included in the research
This report analyses data on gambling advertising spots and spending, placed between 1 May 2022 and 30 April 2023, on:
- FTA metro and regional TV
- metro radio
- online – websites, apps and social media (spend only).
It also includes information about advertising for lotteries, lottos, horse, harness and greyhound racing. This is included to provide additional context around the market for gambling advertising in Australia.
The research provides a picture of the gambling advertising landscape in Australia, with detailed breakdowns on the time-of-day total number of spots, the advertiser type and spend across TV, radio and online.
Services not included in the research
The report does not include advertising on subscription (pay) television as Nielsen Ad Intel information does not capture this data.

Key findings
Ads by online gambling providers are the most prolific of all gambling ads
- Over 1 million gambling ads aired on free-to-air TV (metro and regional) and metro radio, with 50% (502,800 spots) from gambling providers offering online gambling services (online gambling providers).
- 51% (256,200 spots) of the total gambling ads on metro free-to-air TV were ads by online gambling providers.
- 58% (196,400 spots) of the total gambling ads on regional free-to-air TV were by online gambling providers.
- $238.63 million was spent on gambling advertising on free-to-air TV, metro radio and online (including social media) between May 2022 and April 2023.
- Compared with all gambling advertisers, online gambling providers spent the most on free-to-air TV, metro radio and online (including social media) advertising by far, with 64% of the total.
Free-to-air TV is the market with the greatest ad spend
- 68% was spent in free-to-air TV markets ($133m on metro and $29m on regional), 15% was spent on social media ($34.6m), 9% in metro radio markets ($22.4m) and 8% on other online platforms (websites and apps) ($19.5m).
Gambling advertising spots on free-to-air TV peak in the evenings
- 22% of gambling ads shown on free-to-air TV were aired between 7 and 10 pm.
- Between 9 and 10 pm saw the highest number of ads airing in both metro (41,300) and regional (35,800) TV markets.
Gambling advertising spots on radio peak during commuter periods
- Metro radio’s peak times for gambling advertising were during the morning and evening commuting hours (6 to 8 am and 5 to 6 pm).
Detailed findings – gambling advertisers
In Australia, gambling service providers offer a range of different products and services, including online services (for example, sports betting via apps and websites) and in-person wagering premises, for example, TAB premises (see Glossary for definitions). The major products advertised include:
- online gambling services
- lotteries, raffles and instant lotteries
- lottos
- on-premise gambling
- horse racing, harness racing and greyhound racing events.
Television – metro and regional
In the 12 months between May 2022 and April 2023, over half a million (504,100) gambling ads aired on metro TV:
- 51% were ads by online gambling providers (256,200 spots)
- 20% were ads for lotteries (99,500 spots)
- 17% were ads for lottos (84,000 spots).
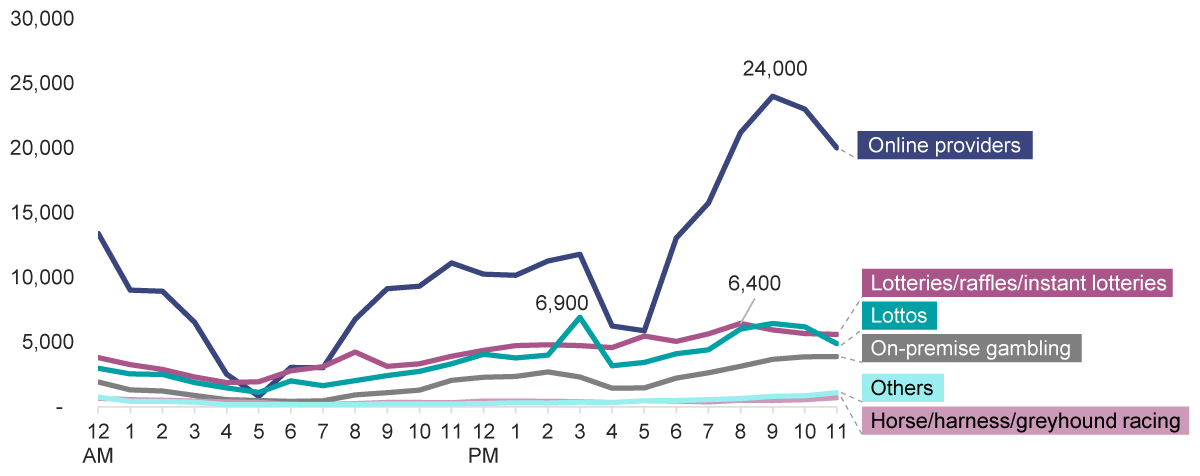
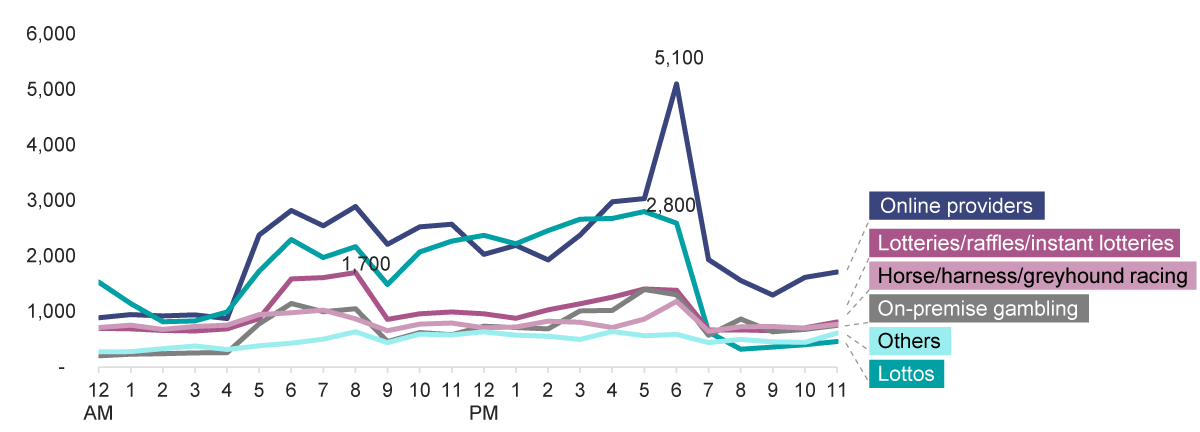
Advertisements from providers of online gambling services increased in the evening and peaked in the 9 to 10 pm hour, with 24,000 spots airing in the 12-month period.
Figure 1: Metro TV gambling ad spots broadcast, by advertiser type and time of day
Notes: Over 12 months – May 2022 to April 2023. Figures are rounded to the nearest 100. Metro TV includes commercial FTA channels and markets as defined by Nielsen Ad Intel. ‘Others’ include casino, tipping competitions and other gambling advertisers.
In regional TV markets, 338,600 gambling advertising spots were aired:
- 58% were ads for online gambling services (196,400 spots)
- 16% were lottery, raffle and instant lottery advertisers (52,600 spots)
- 15% were lotto advertisers (49,600 spots).
Figure 2: Regional TV gambling ad spots broadcast, by advertiser type and time of day
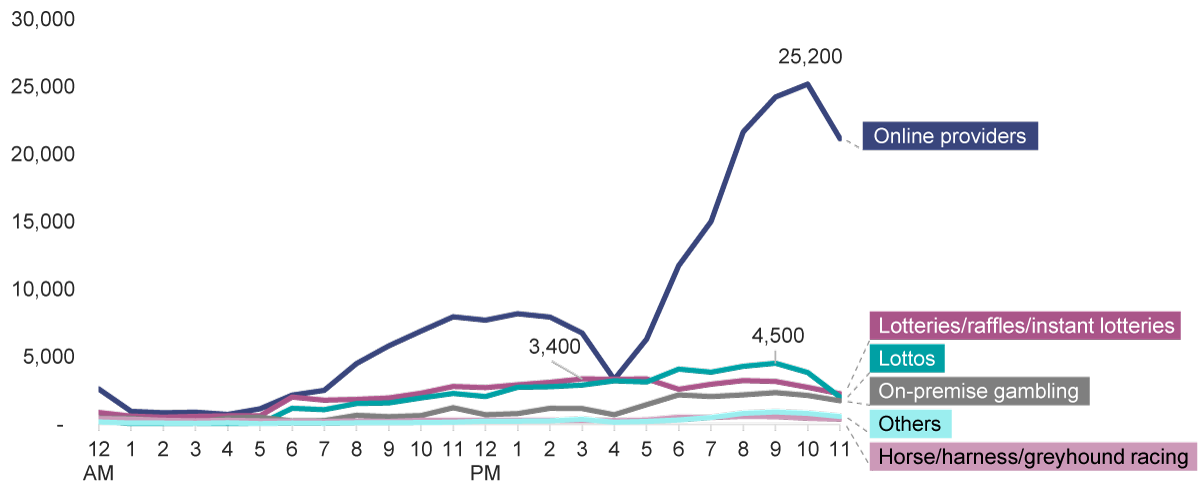
Notes: Over 12 months – May 2022 to April 2023. Figures are rounded to the nearest 100. Regional TV includes commercial FTA channels and markets as defined by Nielsen Ad Intel.
Radio – metro
While providers of online gambling services accounted for the largest share in advertising spots (31% with 50,200 spots) in metro radio markets, the hourly distribution was more even, compared to the metro and regional TV markets.
Figure 3: Metro radio gambling ad spots broadcast, by advertiser type and time of day
Notes: Over 12 months – May 2022 to April 2023. Radio: only includes spots aired in metropolitan markets as defined by Nielsen Ad Intel.
Top 10 advertisers – TV (metro and regional) and radio (metro)
Of the top 10 gambling advertisers with the highest volume of ads that aired on metro and regional TV and metro radio, 5 were providers of online gambling services. Between the 5 advertisers, there were almost half a million gambling ads aired in the 12 months between May 2022 and April 2023.

Advertising spending
In the 12 months between May 2022 and April 2023, Australian gambling service providers spent $238.63 million on advertising on free-to-air TV (in metro and regional TV markets), metro radio and online. Online advertising, as captured by Nielsen Ad Intel, includes social media but does not include other forms of advertising such as print, billboards, cinemas:
- 56% was spent in metro TV markets ($133m)
- 15% was spent on social media ($34.6m)
- 12% was spent in regional TV markets ($29m)
- 9% was spent in metro radio markets ($22.4m)
- 8% was spent on general display (websites and apps) ($19.5m).
Providers of online gambling services spent the most on advertising by far, with 64% of the total.
Figure 4: Share of total gambling ad spend, by advertiser type (%)

Notes: Over 12 months – May 2022 to April 2023. Includes total advertising spend on metro TV, regional TV, metro radio, general display (website and app) and social media.
Detailed findings – peak advertising times
Over the 12 months between May 2022 and April 2023, over 1 million gambling advertising spots aired nationally on free-to-air TV (metro and regional markets) and radio (in metro markets only):
- 50% aired in metro TV markets (504,100, an average of 1,381 spots per day)
- 34% aired in regional TV markets (338,600, an average of 928 per day)
- 16% aired on metro radio (160,700, an average of 440 per day).
- Almost a quarter (22%) of all ads aired between 7 and 10 pm, with the highest number of ads airing between 9 and 10 pm in both metro (41,300) and regional (35,800) TV markets.
Figure 5: Total gambling ad spots broadcast, by time of day
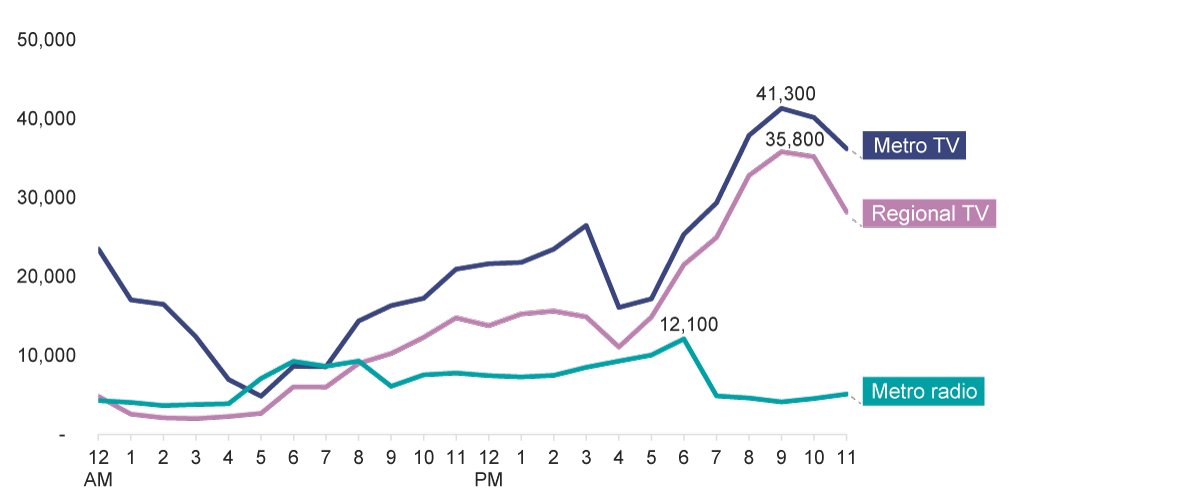
Notes: Over 12 months – May 2022 to April 2023. Figures are rounded to the nearest 100. Metro TV and regional TV includes commercial FTA channels and markets as defined by Nielsen Ad Intel.
For metro radio, more gambling advertising spots aired during morning and evening commuting times. Between 6 and 8 am, 27,200 ads aired, and between 5 to 6 pm, there were 16,300.
Figure 6: Gambling ad spots broadcast, by time of day, metro radio
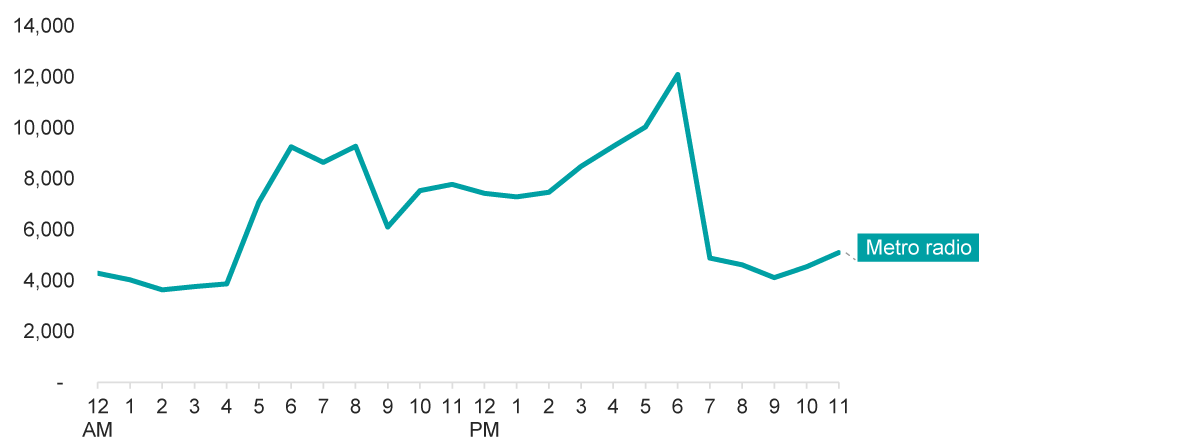
Notes: Over 12 months – May 2022 to April 2023. Figures are rounded to the nearest 100.
Half (50%) of the total gambling ads aired on free-to-air TV and metro radio were from providers of online gambling services. While a greater number of ads were placed in metro TV markets compared to regional TV markets, the peak in regional markets was higher and slightly later in the evening. Spots peaked at 10 pm with 25,200 spots airing in the 12 months, over 1,000 more than the amount that aired at the 9 pm peak in metro TV markets (24,000).
Figure 7: Online gambling provider ad spots broadcast, by time of day
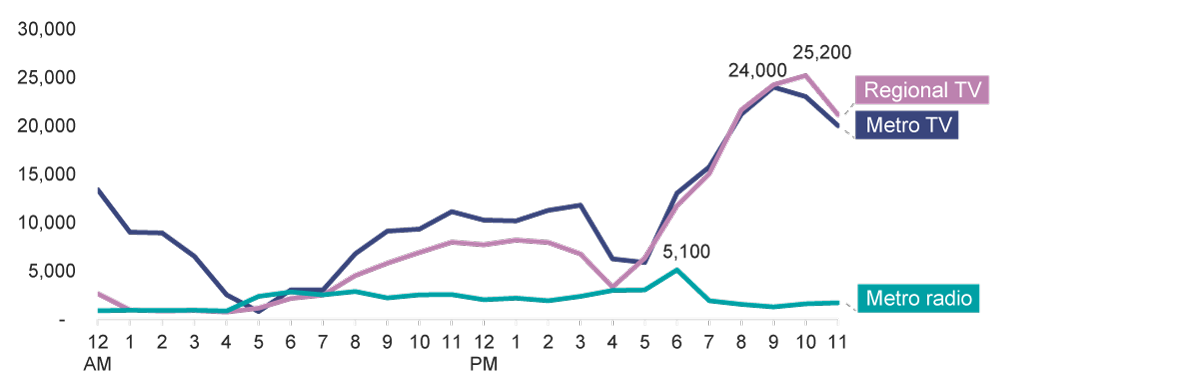
Notes: Over 12 months – May 2022 to April 2023. Only includes the ad spots for providers of online gambling services (for example, advertisers promoting gambling services that allow you to bet online or via an app). Figures are rounded to the nearest 100. Metro TV and regional TV includes commercial FTA channels and markets as defined by Nielsen Ad Intel.

Case study
Table 1: Brisbane (metro) vs Townsville (regional)
| Brisbane | Townsville | |
|---|---|---|
| Population | 3,500,000 | 240,900 |
| Total TV ad spots | 100,500 | 66,700 |
| Average spots per day | 275 | 183 |
| Number of commercial FTA channels | 18 | 18 |
Notes: Average and total based off 12 months (May 2022 to April 2023). Includes metro TV and regional TV spots only, excludes radio. Average spots per day is the mean calculated using the 12 months of data. Figures rounded to the nearest 100 for total TV spots. Population estimates are from the OzTam and RegTAM universe estimates. Both markets have 18 FTA channels, however 9Rush is not broadcast in Townsville and Sky News Regional is not broadcast in Brisbane.
There were around 40% more gambling spots on TV in Brisbane than in Townsville.
Brisbane has an average of 275 spots per day, compared to Townsville’s 183 spots airing across 18 commercial FTA channels.
Brisbane’s population is far greater than Townsville, and the cost of advertising is generally greater than Townsville, however, advertising in regional areas might give advertisers a similar cost per potential viewer to spots airing in metro markets.
Glossary
General display – online advertisements such as images, videos or gifs shown to users on websites or apps.
Lotteries – purchasing numbered tickets that are drawn at random to win a prize.
Lottos – games where participants try to match their numbers with numbers pulled out of a draw to win a prize.
Metro radio – includes metropolitan radio markets as defined by Nielsen Ad Intel.
Metro TV – includes commercial free-to-air channels and metropolitan markets as defined by Nielsen Ad Intel.
Online gambling providers/services – refers to advertisers that provide gambling services that allow you to gamble online or via an app.
On-premises gambling – services that allow certain in-person gambling at specific premises (for example, TAB and Keno).
Regional TV – includes commercial free-to-air channels and regional markets as defined by Nielsen Ad Intel.
Social media – online advertisements such as images, videos or gifs shown to users via social media platforms.
Total gambling advertising – all gambling advertising commercials, including all sub-categories.
SOURCE: The Australian Communications and Media Authority (ACMA).